Good day, Poptropicans! It’s been a while since we conducted the 2020 PHB Readers’ Survey, but we’re finally ready to bring you the results with our analysis. Thanks to everyone who participated!
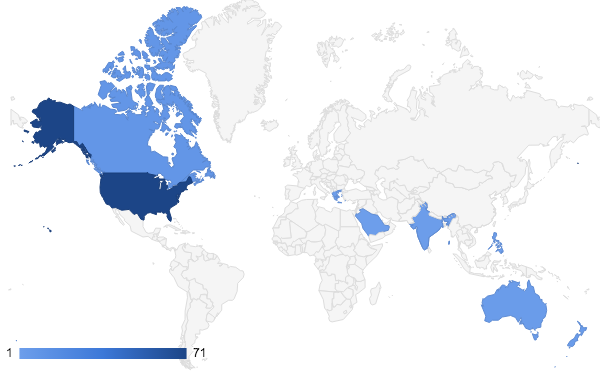
A couple months ago, we conducted our annual survey to gain greater insight of our reader base: you guys! In the three weeks the survey was open, we received 108 responses (an increase from last year) from Poptropicans all over the world. Really—here’s where in the world PHB readers say they’re from:
What country do you live in?
By the way, yes, (some of) our charts in this post are interactive, so hover your mouse around to view the data! Here are the rest of the results…
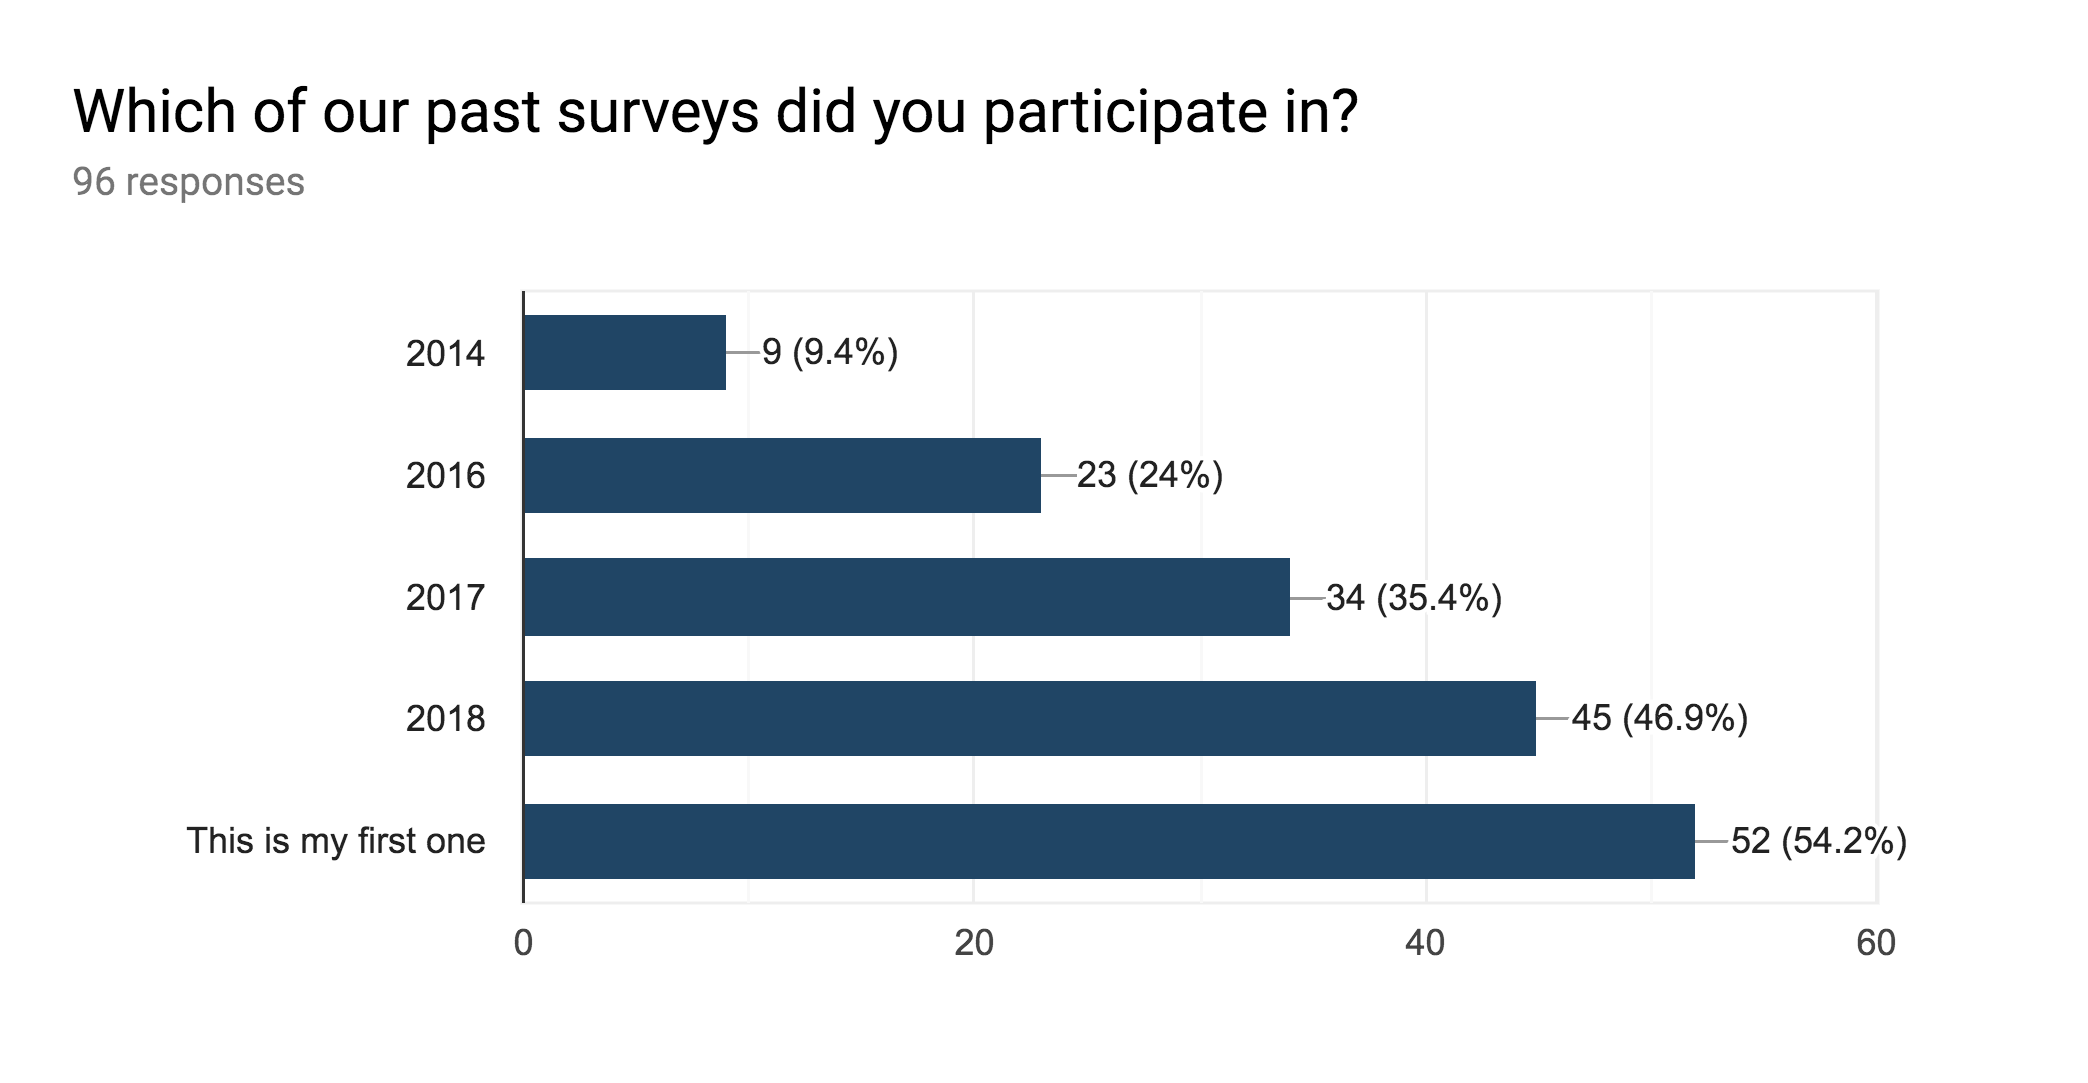
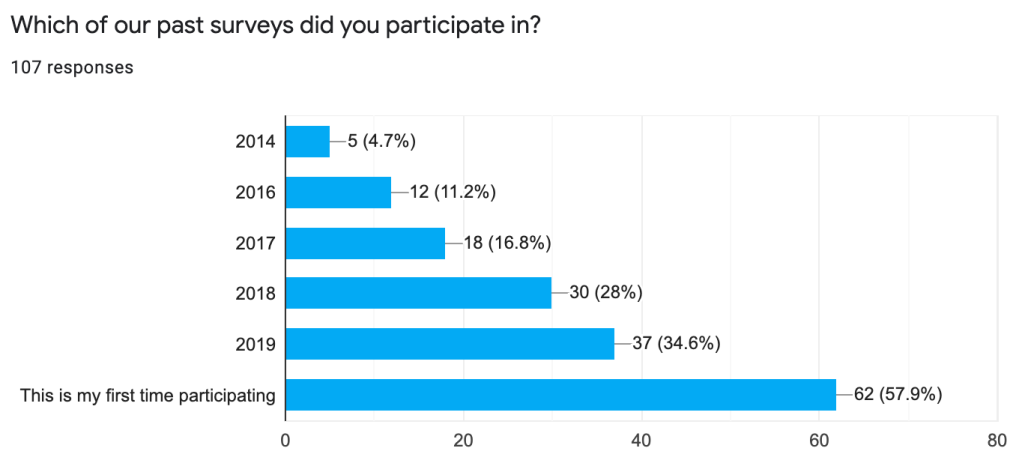
Which of our past surveys did you participate in?
Over a span of 7 years, the PHB has held a total of six surveys to better understand our reader demographics. Once again, we were eager to know how many of you taking this year’s survey have been around long enough to participate in those of previous years. For many of you, it was your first PHB survey, but even more of you had participated before, too.
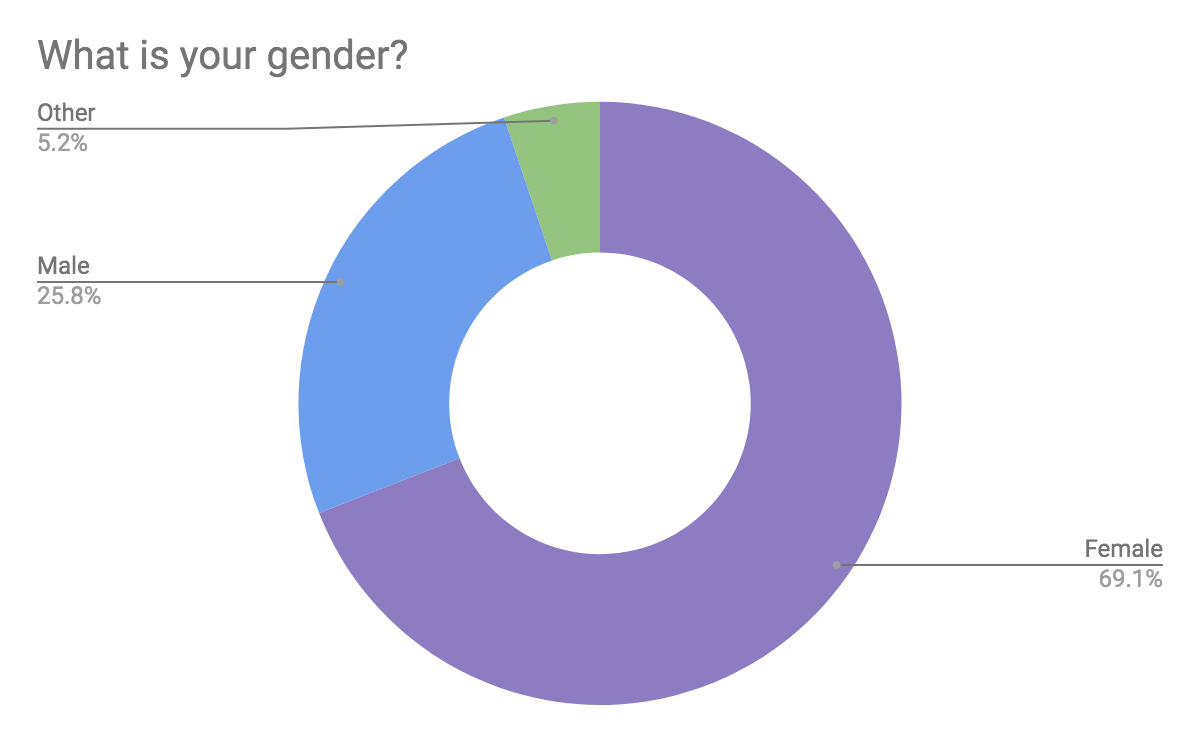
What is your gender?
Like last year, girls make up the majority gender of PHB readers, but it’s mellowed out a bit with 63% this year compared to last year’s almost 70%. The proportions of boys and nonbinary people remains similar as well.
What is your age?
Most of our readers say they’re aged 15–18, which is on par with last year’s results. Notably, the 19–21 age group has increased. They’re now tied with the 12–14 group, compared to last year when they only matched about half the amount of 12–14s and were only the fourth largest group.
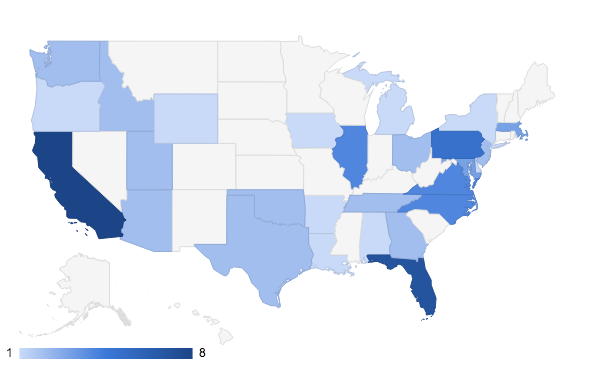
If you live in the US, which state or territory?
Like before, the most represented states tend to be the more populous ones. California leads this time, with Florida not too far behind. A few of you claim New York and North Carolina as home, and Poptropicans scattered all over the country are reading this blog.
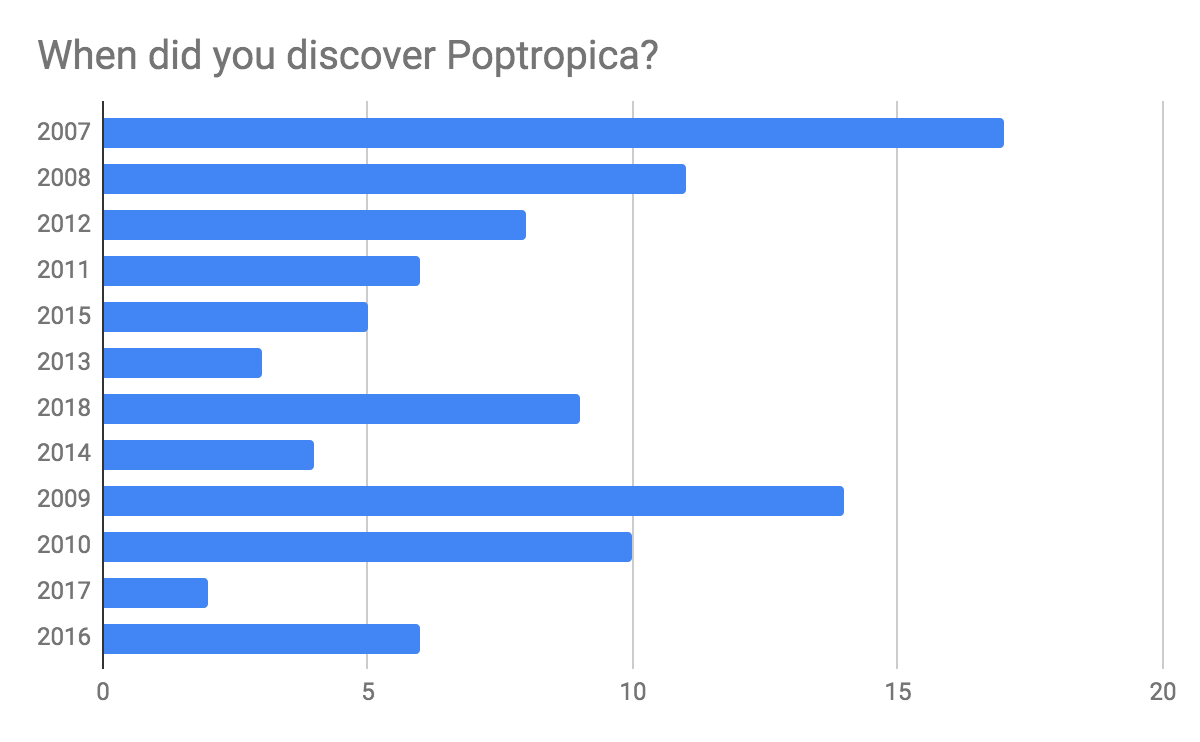
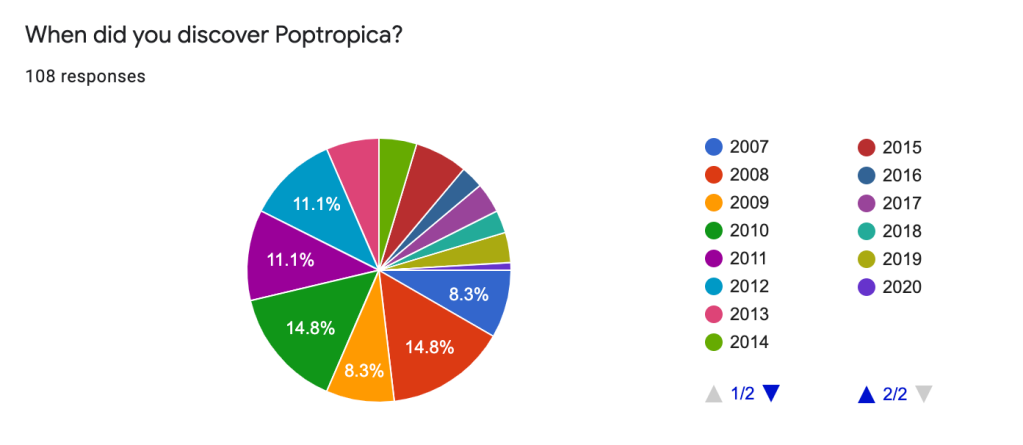
When did you discover Poptropica?
As previous surveys have shown, many of you found Poptropica in its earlier years, particularly during their prime era when islands were released much more frequently. 2010 and 2008 are the top answers at nearly 15%, followed by 2011 and 2012 at 11%.
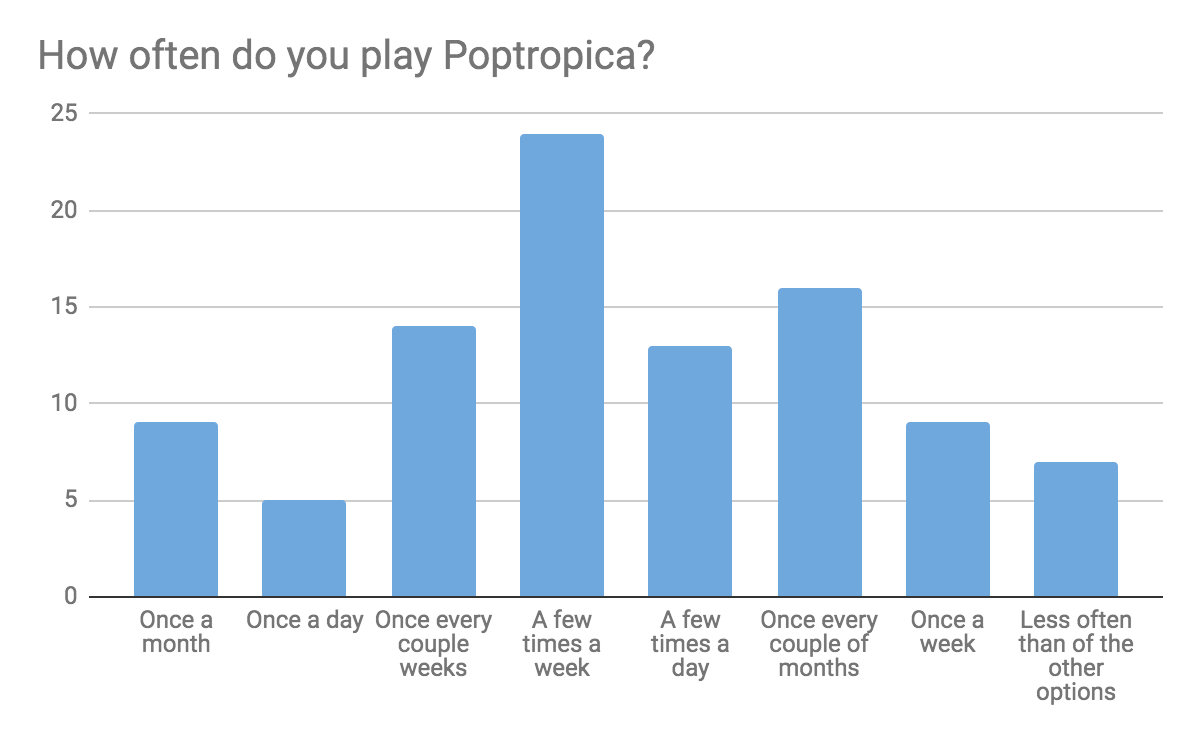
How often do you play Poptropica?
Most of you said you play Poptropica about once every couple weeks, down from last year when the most common answer was a few times a week (which was the second most common answer this year). Looks like Poptropica’s weekly store updates and daily credit rewards do interest some of you enough to log in, but let’s be real, they’re going to need more than that to reel everybody back in! As always, though, this chart is otherwise fairly evenly split between all the other options.
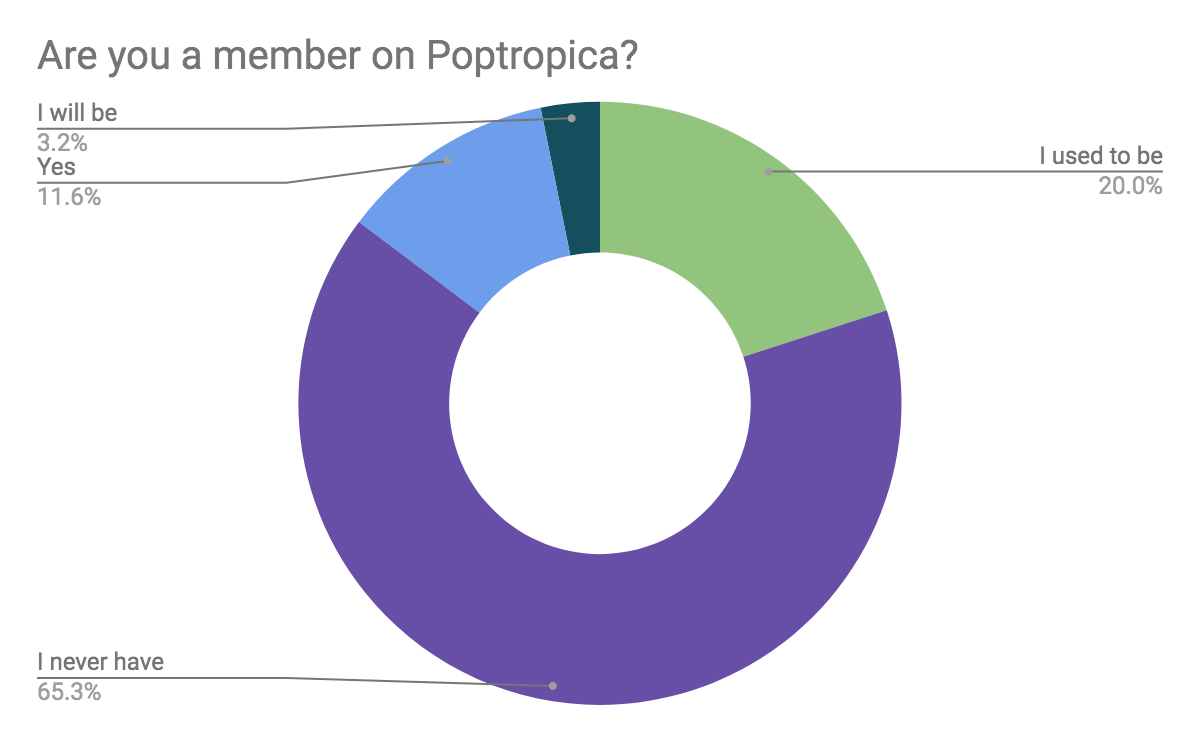
Are you a member on Poptropica?
Continuing the trend from last year, a ~64% majority of you have never been members nor have plans to be. More of you are saying you used to be (27%, up from last year’s 20%), and a smaller sliver are saying you currently have membership (7%, down from 11.6% last year) or that you will be (~2%, down from ~3%). Note, these answers came in before the classic islands were re-released for members only a few weeks ago.
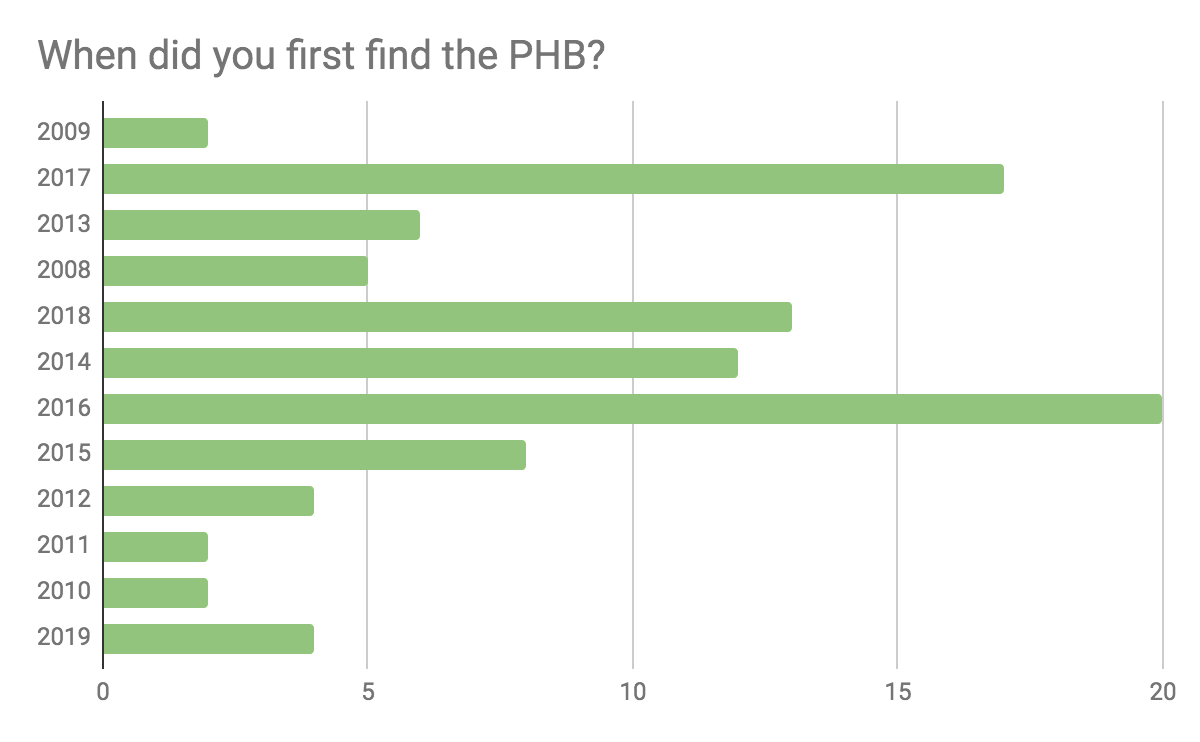
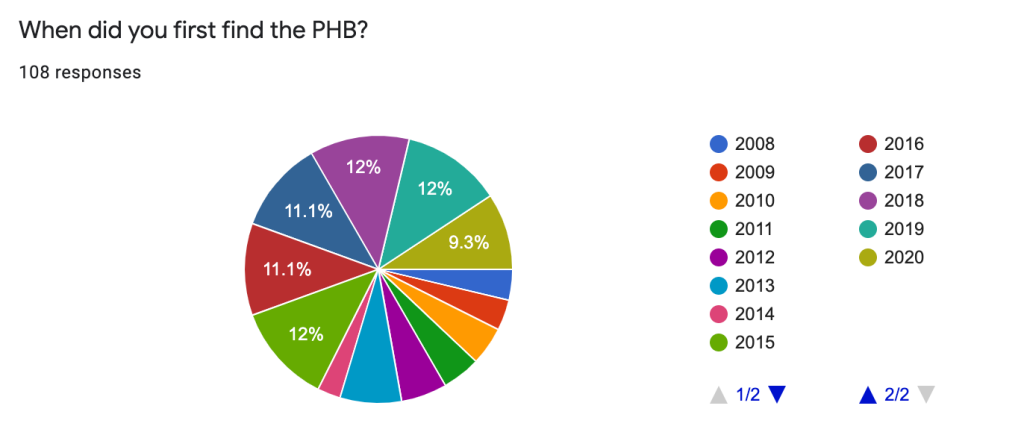
When did you first find the PHB?
The results for this question were pretty evenly distributed over the years, with the top answers being more recent years: 2015, 2018, and 2019 all shared 12%, with 2016 and 2017 at 11% and even 2020 at 9.3%! Earlier years got smaller slices of the pie, but it still overjoys us to see that there are few who’ve been with us since the beginning.
How did you find us?
Not surprisingly, most of you (73.6%) discovered the PHB through searching the web. Other answers, tied at 8.5%, include hearing about us through a friend or sibling, as well as through another website, which is similar to results from before. But “a website link written on the school playground”—now that’s a new one!
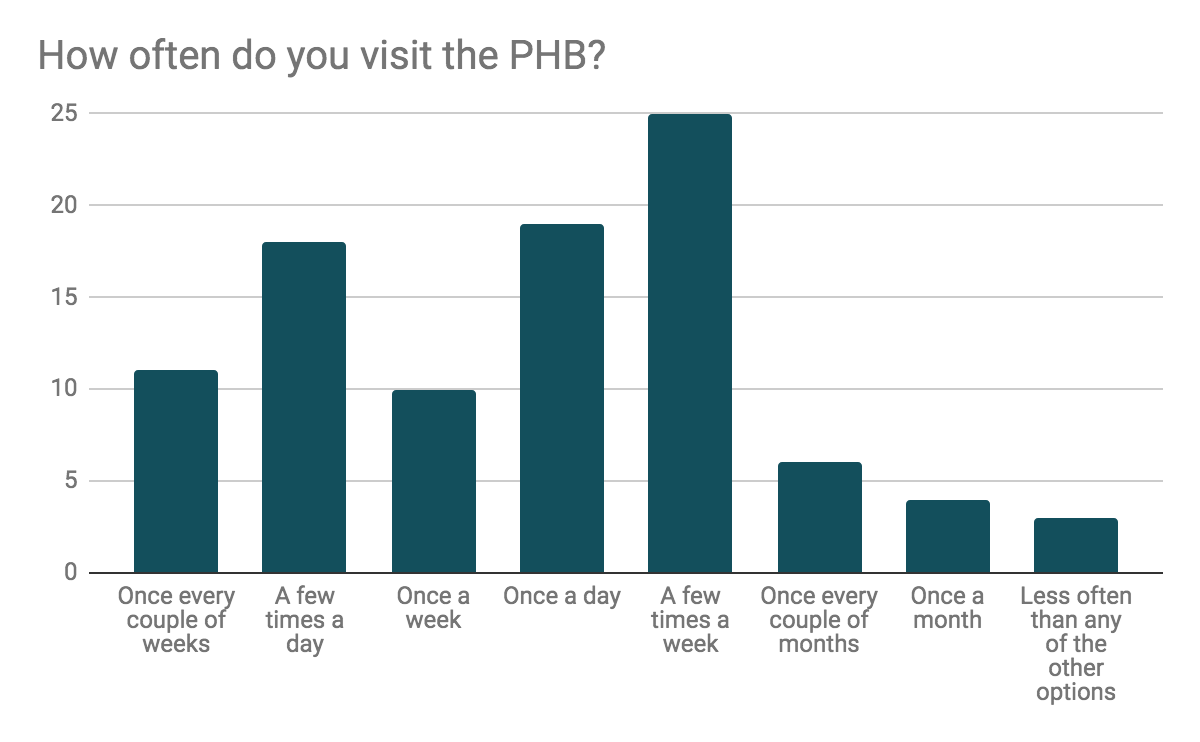
How often do you visit the PHB?
Maybe asking on the PHB brings biased answers to this question, but hey, most of our readers say they’re checking in on us a few times a week—which is more than how much they’re logging into Poptropica itself! However, the second and third top answers are down from last year’s, being once every couple of weeks, or once a week, rather than once or a few times a day in 2019. We can’t promise to post every day, but we do try for a couple updates (or more) per week, so stay with us!
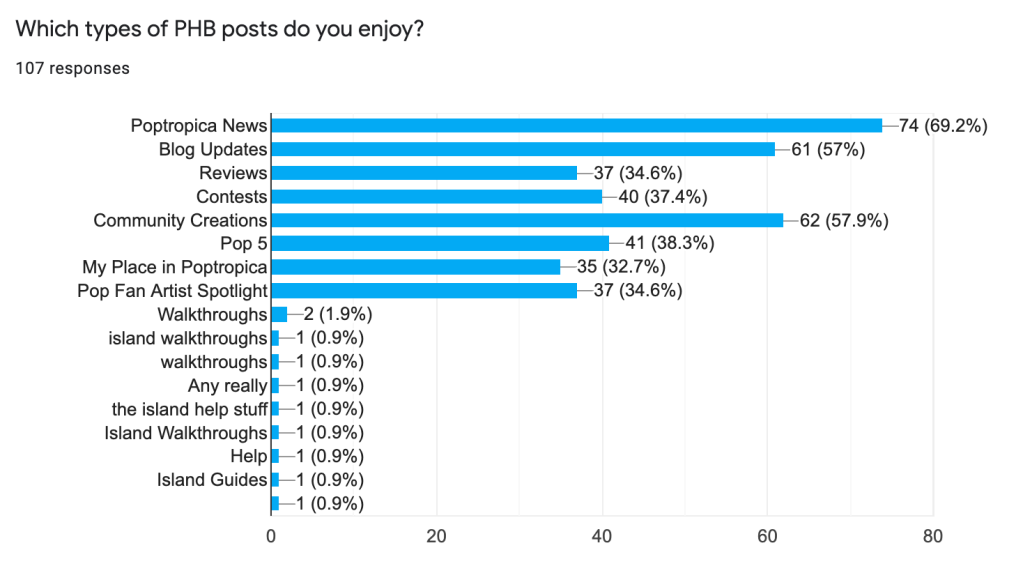
Which types of PHB posts do you enjoy?
Multiple answers could be selected here, which is why percentages add up to over 100%. As with previous years, the top answer continues to be news, which works out well as it’s the main thing we post! Many of you also enjoy our blog updates (which covers every time we post, basically) and Community Creations series. Lots of you like our walkthroughs too, but we didn’t count them as posts since they’re not exactly blogs, but are separate pages! Anyway, we’re always looking out for cool bits from the Pop fandom to spotlight, so consider sending in a guest post, too. 🙂
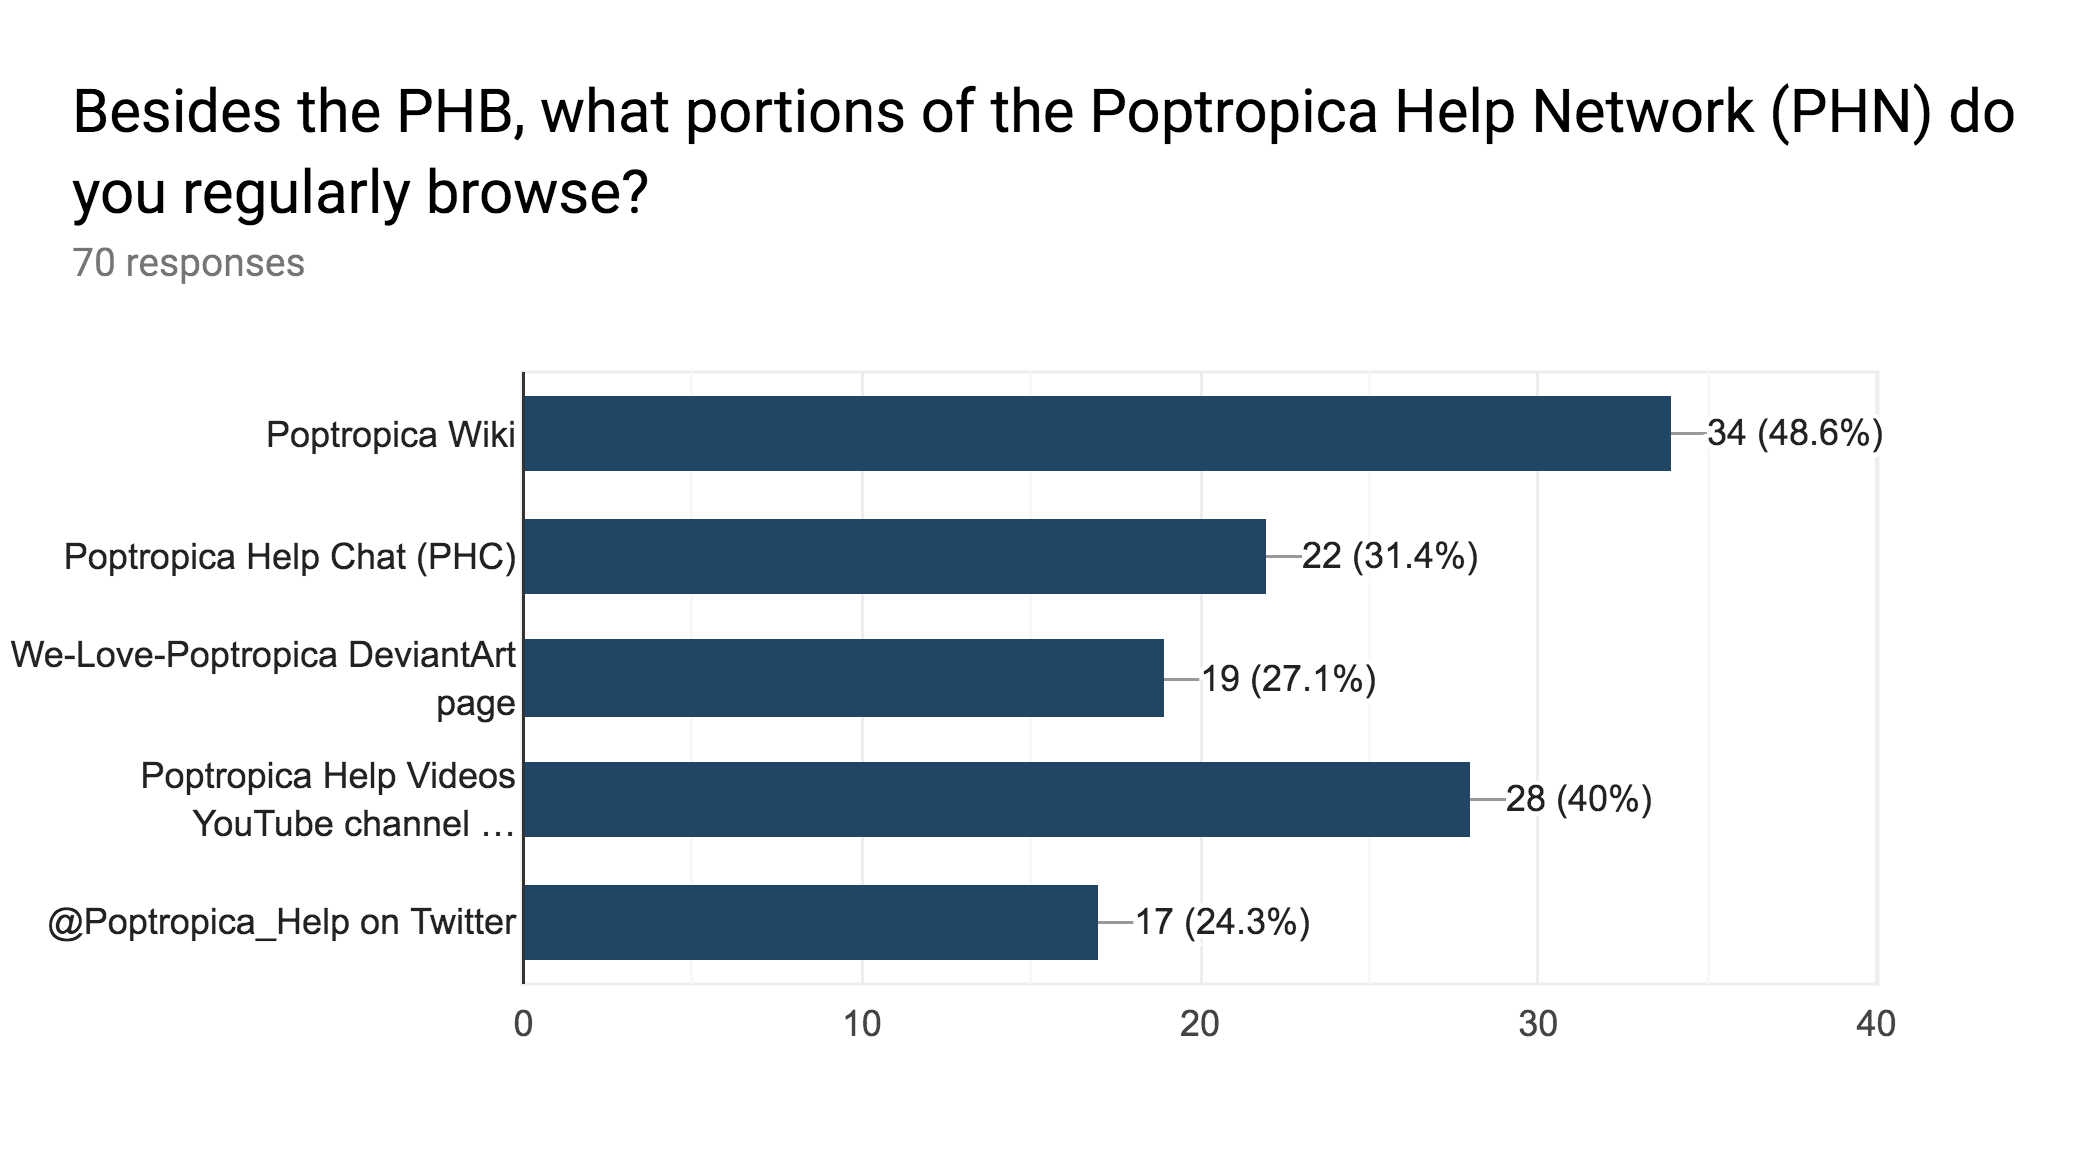
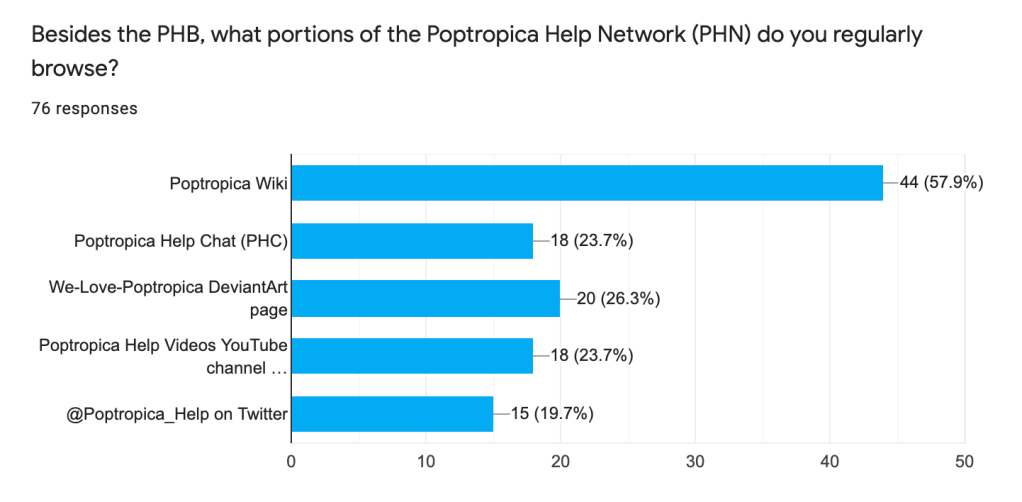
Besides the PHB, what portions of the Poptropica Help Network (PHN) do you regularly browse?
Although a chunk of survey respondents opted not to answer this one, among those who did answer, the Poptropica Wiki continues to be the most popular of the non-PHB sites in the Poptropica Help Network. The other options were only about half as popular, but hey, consider them checking them out! Even with lower activity, these places still have some good content from the past to look back on, and the DeviantArt group in particular still gets new art entries fairly often!
What other Poptropica blogs/fansites do you frequently visit?
We also wanted to know what other Poptropica fan sites you like to keep up with so we can share more Poptropica joy in different spaces. Although there aren’t many active ones these days, some of you mentioned places like Poptropica Tips for Poptropicans, Shiny Bird’s Poptropica Blog, Sporty Boa Blog, Quick Fang’s Poptropica Fun Blog, the Poptropica Club Discord server, Poptropica blogs on Tumblr, and the Pop community on Instagram.
Go check them out! Keep in mind that these sites aren’t affiliated with the PHB, though, so we can’t be responsible for their content. And if you contribute to those spaces, keep it popping—you’re doing great!
Anything else you’d like to add?
For those of you who took the time to write in a comment at the end, we want to affirm that we read each one and appreciated the feedback! Some common themes were keeping the community spirit alive despite the lack of game updates, doing more interactive contests with fans, plus more special posts like fashion ideas (check out our Pop-over series!), Pop Places IRL, and even tribe wars (have you seen our Tribal Tournament?).
Here are a few of the comments we received below, to give you all a taste of the thoughtfulness behind the PHB community:
I really enjoyed the Poptropica trivia and the costume closet page. Please post more behind the scenes stuff if you get exclusive access to it. I really appreciated your blog back in the day, when Poptropica was way more active, but since it kinda died down due to the whole Adobe Flash situation, I started playing less and left for a long time, but alas, the quarantine brought me back. Just wanted to let you know that I really appreciate your efforts in keeping the blog and the fanbase active despite Poptropica’s current status and decreasing popularity.
Anonymous
Thanks for those kind words, they mean a lot! For those who want to revisit our trivia, we post fun facts about each island at the end of all our Island Guides. You might learn something new! Plus, over the years we’ve created a lot of good stuff collected under our Pop Plus page, so check that out too. 🙂
I think we should focus more on maintaining our small community. Poptropica’s getting old as well as the audience. I think it’s best that we do more events, getting to know each other, and do activities. We could probably do some brainstorming via social media. I haven’t been in touch with the Poptropican Discord server because the last time I checked (which was probably a year ago), the server was kinda dead. I might try to see which places Poptropicans are the most active and figure out how we could gather up everyone and increase activity without things getting boring pretty quickly.
Also, we should make sure that the Poptropica creators are aware that us Poptropicans are still here waiting for new content. As well as there a plenty of us who are willing to volunteer for beta tests or what not. I hope that Poptropica will live long enough to become a legend that will continue on for generations like the Pokemon and Mario franchises. I think we as a community should play a part in trying to market Poptropica and get more people to join in. We could probably make up fan stories, legends, make more memes that are actually funny, and build connections within other communities so that they’ll get interested. I don’t know what else to think of. But I really don’t want to let go of another childhood memory. I’m proud to be a Poptropican veteran. Long Live Poptropica!
Popular Biker
We love our Poptropica community, and we’re glad to hear it from you guys too! If you’re looking to get plugged in, we’ve list some places on our Community page. Although our PHC Discord server isn’t as active as it used to be, we do post updates there from time to time, and Poptropicans can be found on other servers including the aforementioned Poptropica Club. And we’re still keeping the PHB active, including the comments sections!
The Poptropica Creators have mentioned in their posts that they’re listening to what players want, even suggesting that there may be future opportunities to beta-test their Haxe build. All the other suggestions about spreading the word are great too. As our survey results show, it’s true many in the fandom are also Poptropica veterans who have stuck around (or re-found the game) for nostalgia—which is a pretty powerful force. Long live Poptropica, indeed! 👑
Contests are a pretty good way to keep people engaged in the game, it would be especially good now since people are staying inside and I have a feeling that they are bored. However the blog seems to be doing pretty well right now, especially with the lack of updates the creators are putting in. Keep doing what you guys are doing!
Kashews
Contests are always fun, and since several of you brought it up, we hope we can bring you more of them in the near future! Stay tuned; we just might have something planned… 😉
Thanks for tuning into our PHB survey results, and we’ll see you next time!
—the Poptropica Help Blog—